
Another in a many years-long list of studies, showing that “virtualizing”, a frequent goal of “sustainable” or “green” designers, in fact may result in a higher carbon footprint for a product or service than the physical medium it replaced.
In this new study, researchers at the University of Glasgow and the University of Oslo, compared carbon emissions due to plastics manufacture for CD discs and cases, versus the electricity needed to run real-time streaming over the Internet.
https://www.gla.ac.uk/news/headline_643297_en.html
These guys have an axe to grind (clear association with traditional media fanatics) but the results still stand.
A few quotes:
“Storing and processing music online uses a tremendous amount of resources and energy, with a high impact on the environment”
- Kyle Devine, an associate professor in music from the University of Oslo.
“We see raising awareness of the findings as a first step towards developing alternatives, where music consumption can become both economically sustainable for makers while being environmentally sustainable for the planet”
- Matt Brennan, reader in popular music from the University of Glasgow
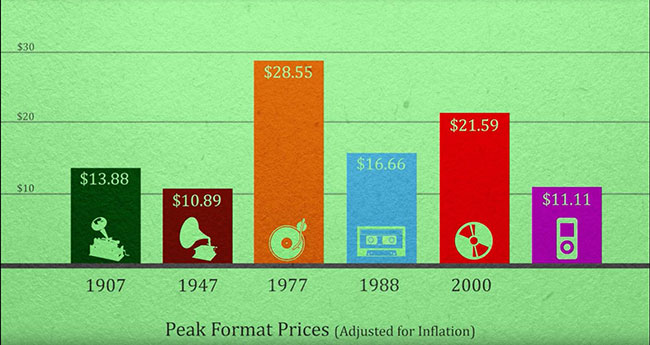
A key point here is the mismatch between the price of an item, and the “carbon footprint” cost of the same item. In the case of music, the switch from CDs and LPs to streaming causes the price for consumers to drop, while the carbon footprint of listening to music steadily rose. This chart shows the inflation-adjusted cost of music during the last 130 years:
During the 2000s and 2010s, digital consumption of music has soared, and the effect is strongest in countries with an emerging consumer culture like China. Worldwide, about 30% of music in 2016 was consumed via CDs, with about 70% for streaming. The USA is 75% streaming, 25% CDs, up from 50:50 in 2016.
But in China, the number for streaming was 96%.
Despite the drop in consumer costs for an album of music to their lowest level, greenhouse emissions have actually spiked as services like iTunes and Spotify replace plastic CD production. To quote:
The research shows GHGs of 140 million kilograms in 1977, 136 million kilograms in 1988, and 157 million in 2000. But by 2016 the generation of GHGs by storing and transmitting digital files for those listening to music online is estimated to be between 200 million kilograms and over 350 million kilograms in the US alone.
Now, we are not looking at per-capita music listening, which is also up. While the US population grew slowly during the 2000s and 2010s, music listening, accd. to Nielsen is up considerably. Between 2015 and 2018, the average number of hours listening to music went from 23.5 hourst to 32.1 hours per week. This is an extraordinary number.
https://www.statista.com/chart/11728/weekly-music-consumption/
Typically, environmentalists and greenie “woksters” focus on the plastic produced, due to the realization that plastics are invading the marine ecosystem. And, plastic production due to music is way down compared to the late 20th century (61 million kilograms at its peak, versus about 8 million kilograms today).
But net greenhouse emissions are up. This is due to the amount of electricity used by streaming services, which generates GHGs. Also, the streaming format clearly encourages increased music consumption. Greater efficiency, or per-song cost reductions don’t matter if the absolute amount of energy production rises due to the tech. And, the price of this music has dropped, giving consumers the exact opposite signal about the environmental effect of their listening to digital music.
Remember that these studies don’t consider the cost of manufacturing digital devices for listening to music, or the costs of manufacturing and maintaining the physical Internet, which drives the cost even higher.
The report also is a good example of Jevons’ paradox. While the numbers aren’t reported, it’s a safe bet that dropping the cost of digital music increased consumption, raising greenhouse gases per capita even in the absence of the impact of an always-on electricity consuming system like the Internet. People greatly increased their consumption of music in response to a drop in price and greater ease of use, creating – you guess it! – more greenhouse gases. The Nielsen report has direct evidence of this – people with more digital devices in their home listened to more music.
One final aspect of these reports is transparency – all the numbers are there. For the original report, you can download all the spreadsheets which were used to reach the authors’ conclusions at:
http://eprints.gla.ac.uk/183249/
This is great, because numbers are how you end the so-called “conversation” or “debate”. Too often, environmental issues are reasoned out like they were philosophical positions, where in reality we can actually “do the numbers” on environmental impact.
For Sustainable Virtual Design, this shows that “virtualization” increases, not decreases, the burden on the Designer to improve their energy efficiency and sustainability, as well as user consumption patterns.
